RFForge
Equation-grounded RF and microwave design tool for power-amplifier matching. Interactive visualisations, auditable worked examples, and an AI layer that explains the numbers without ever touching them.
- TypeScript
- Next.js
- Tailwind CSS
- Groq
Why I built this
Students and early-career engineers working on power-amplifier design at 60 GHz, 140 GHz, and beyond study from scattered reference equations across textbooks — with no single place to experiment with real design tradeoffs. How does match quality change with frequency? How does power-added efficiency respond to compression? Why is sub-terahertz design fundamentally harder than sub-6 GHz?
RFForge consolidates those scattered concepts into one interactive instrument. It's built for RF students, research-lab applicants who need to demonstrate competence, and early-career engineers who want a fast sanity-check tool — and it has to read as a real instrument at a glance, with every number legible and every result traceable to an equation.
My approach
RFForge is not a simulator and not a black-box estimator. Every engineering result comes from deterministic calculation logic written as pure, independently testable functions: real amplifier and network parameters in, impedance matches, PA metrics, and frequency-loss behavior out.
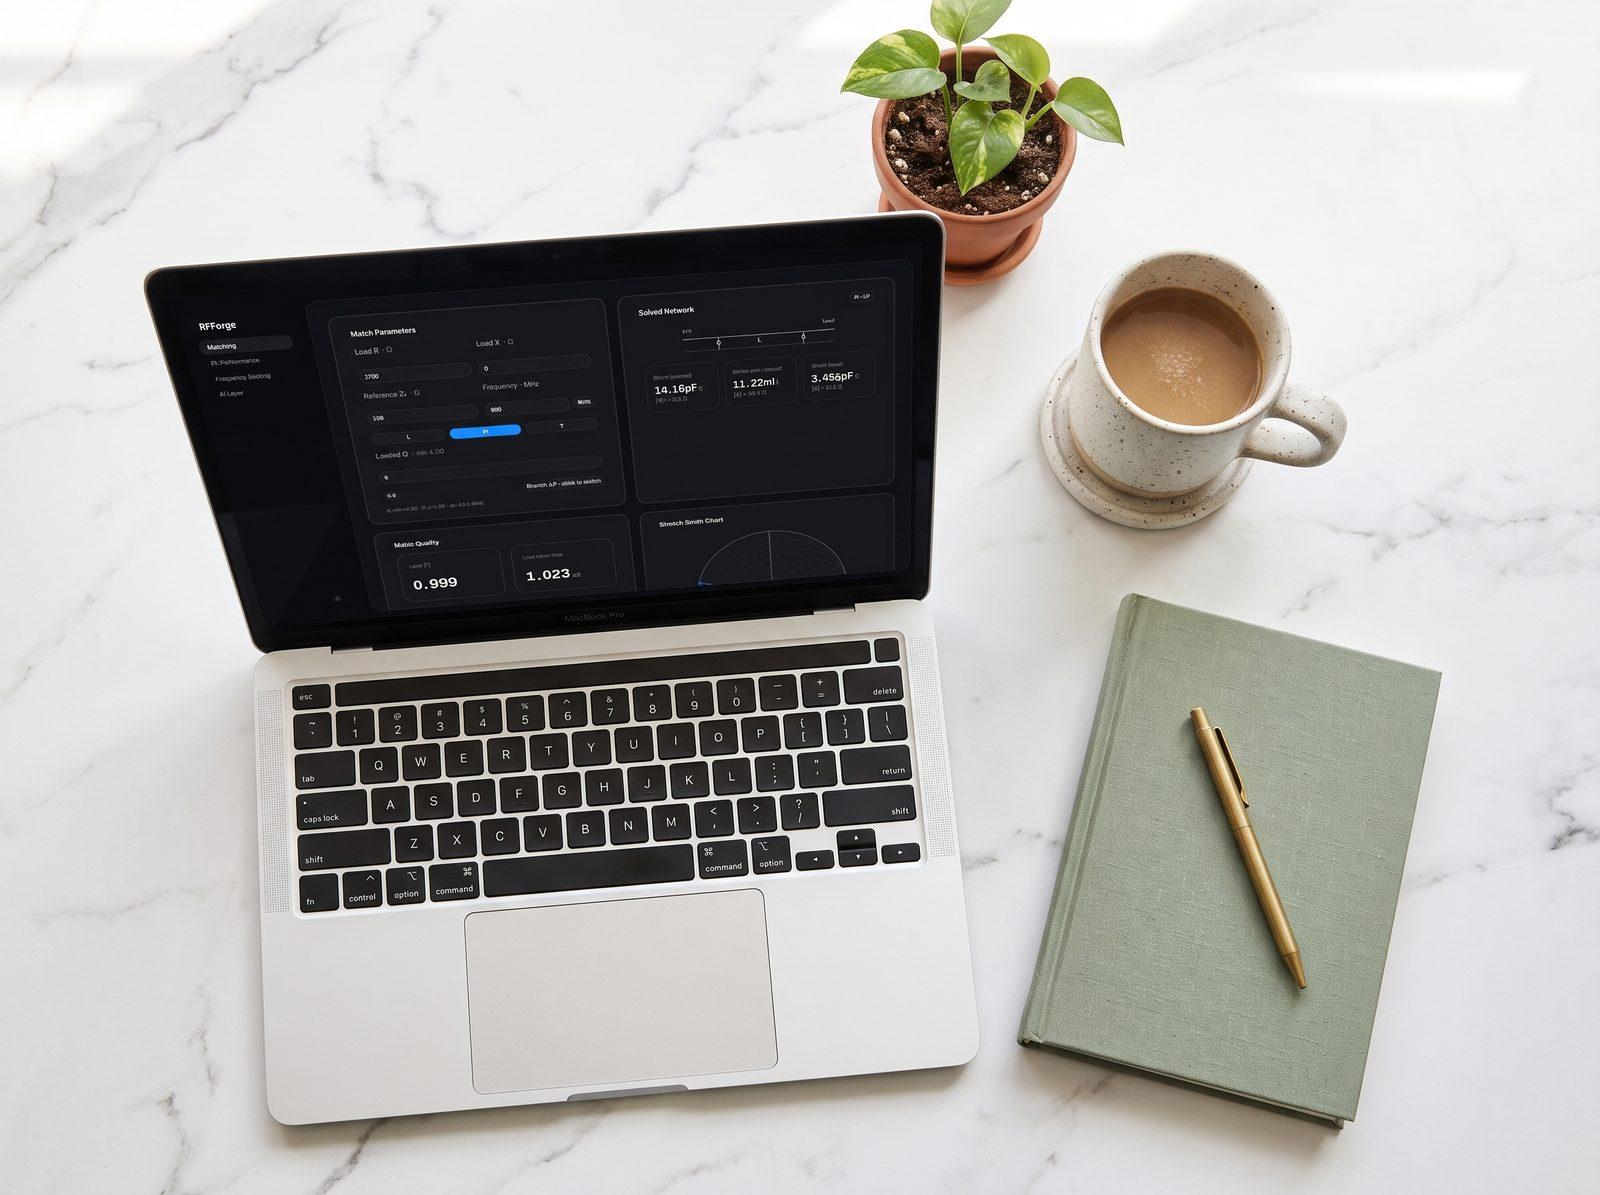
The app is organized as four instrument panels. Module A designs impedance matching networks — complex impedances in, reflection coefficient, topology choice across L, Pi, and T networks, quality factor, and physical L/C values out, with the bandwidth tradeoff visible immediately. Module B traces PA performance across an input-power sweep: P1dB, saturated power, PAE and drain efficiency curves through compression into saturation. Module C sweeps frequency to show how parasitics detune the network — insertion loss and inductor-Q degradation annotated at sub-6, 24, 60, and 140 GHz. Module D is the AI explanation layer, strictly read-only: it receives calculated numbers and explains what they mean, never generating or altering a value, with a template fallback when generation is unavailable.
Accuracy is the foundational requirement, so matching math is validated against worked examples from standard references, PA curves against published datasheet shapes, and scaling behavior against established RF principles. Equations are documented with references, and validation coverage lives with the project docs.
Key features
- Matching network designer. L, Pi, and T topologies from complex impedances, with Q factor, component values, and bandwidth
- PA performance calculator. Compression curves, P1dB, saturation, PAE and drain efficiency across the full sweep
- Frequency scaling visualizer. Insertion loss and Q degradation from sub-6 GHz to sub-THz, with standard band markers
- Read-only AI explanations. Plain-language commentary on your numbers, clearly labeled, toggleable, never mixed into results
- Instrument-grade UI. Bento panels, mono numerals, per-module accent colors, charts treated as the centerpiece
How the system works
Enter parameters, watch the instrument respond — calculations update live as inputs change.
- Enter source and load impedances, reference impedance, and operating frequency in the matching panel
- The solver computes reflection coefficient, picks a topology, and derives Q factor plus series and shunt reactances
- Reactances convert to physical inductance and capacitance values, with match bandwidth shown alongside
- Set PA parameters — supply, gain, saturation, sweep range — and read P1dB, PAE, and efficiency curves off the sweep
- Run the frequency sweep to see SRF, insertion loss, and Q degradation climb toward sub-THz bands
- Toggle Explain for AI commentary on any module's results — or keep it off and read the numbers raw
Challenges & lessons learned
The hard constraint was credibility: a tool like this is useless if its numbers can't be trusted. So validation was designed in, not bolted on — worked examples from reference texts, datasheet curve shapes, and reviewer checklists, with the methodology separating calculated values from AI text at every layer.
That separation shaped the architecture. The AI layer only ever receives finished numbers as context, its output is visually fenced off from computed results, and a template fallback keeps commentary available with no keys configured. The AI explains the instrument; it is never part of the measurement.
On the interface side, the lesson was restraint: charts carry the product, so line weights stay disciplined, annotations support reading instead of cluttering, and motion exists only to communicate state change as live calculations update.
What's next
- More matching topologies and network options beyond the current L, Pi, and T set
- Save and share designs, so a worked example can be linked instead of screenshotted
- Multi-stage amplifier chains — explicitly out of the initial scope, and the natural next depth step
- Expanded validation coverage as new modules land, held to the same worked-example bar